
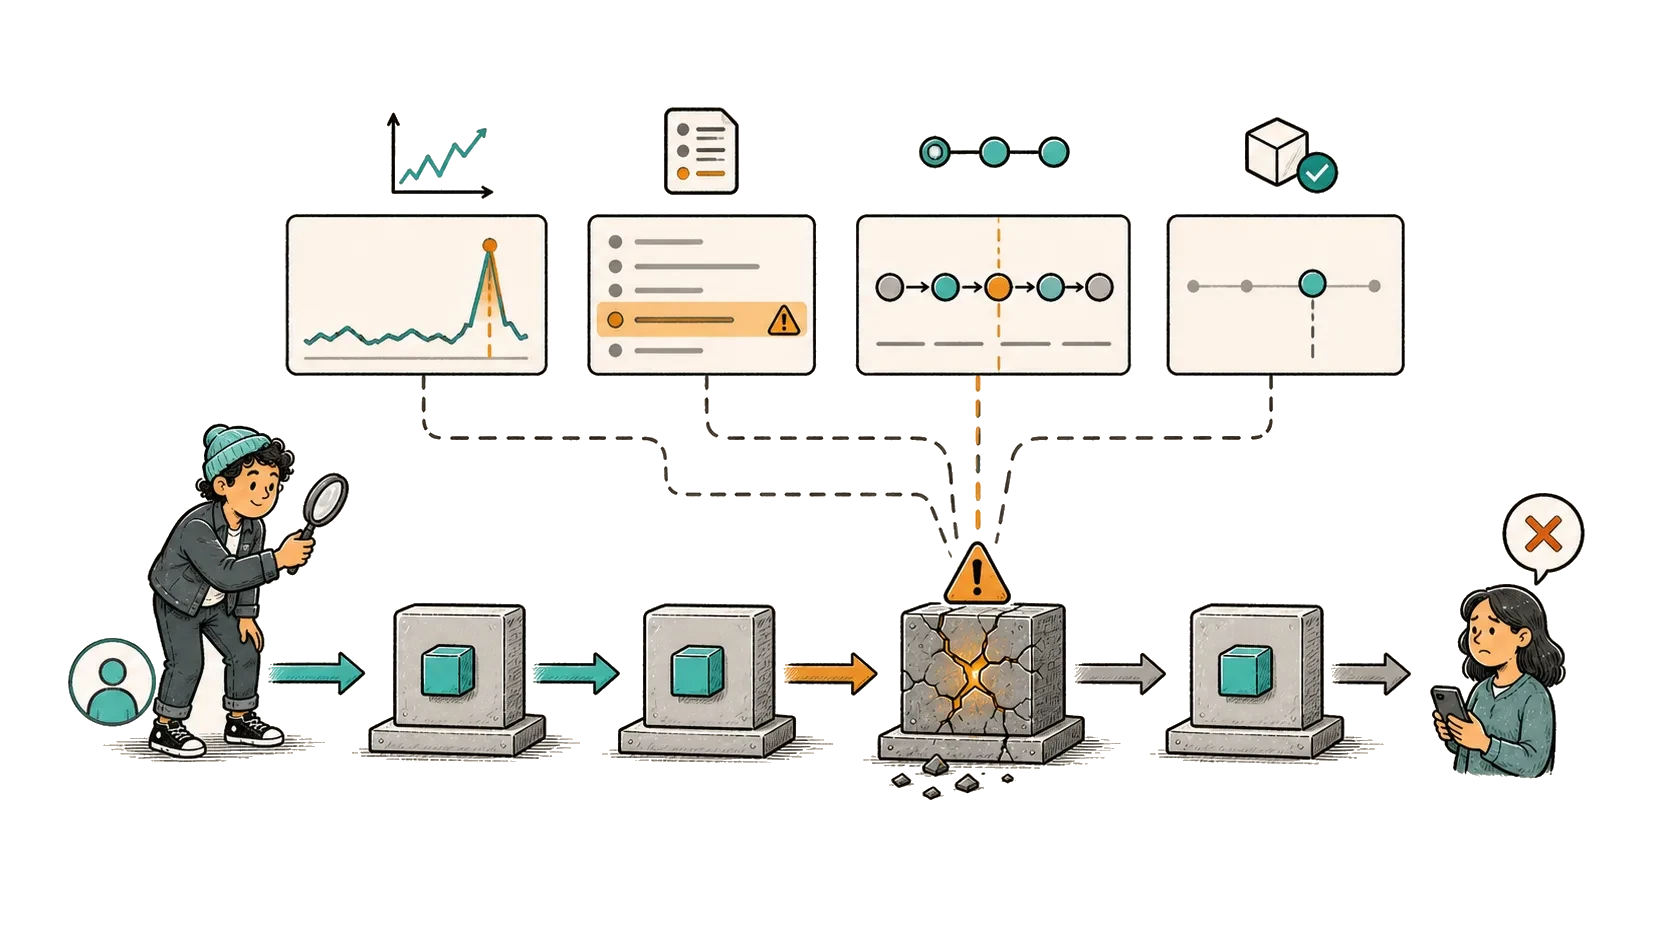
A payment API can return a successful response because it accepted the work. The customer can still fail later if the queued message stops moving or the provider callback is rejected. That is why I do not treat HTTP availability as payment reliability.
I worked on Spring Boot WebFlux services that handed payment work to RabbitMQ and stored the final state in PostgreSQL. Redis reduced repeated reads, while Prometheus and Grafana exposed production behavior. The useful observability model followed the payment through those components instead of showing each component in isolation.
Start with the payment state machine
The first dashboard should not begin with CPU or pod count. It should begin when the platform accepts the payment and end when the customer can see a final result. That result is a terminal state: a status such as completed or rejected where no more processing is expected. Between acceptance and that state, each change emits an event with a timestamp and outcome. A safe correlation value lets the operator follow one payment without exposing payment data.

The decision was not to discard the HTTP indicator. It was to stop treating it as the main reliability result. A 202 response means the platform accepted work; it does not prove that the work completed. For this asynchronous path, the primary service-level indicator, or SLI, measures the proportion of valid attempts that reach an allowed terminal state inside the promised time.
| Journey boundary | User-relevant question | Primary evidence |
|---|---|---|
| API acceptance | Did the platform accept one valid request? | Compare accepted attempts with internal rejections. |
| Queue handoff | Did the command enter durable processing? | Confirm the publish, then watch the age of the oldest message. |
| Provider interaction | Did the external operation finish? | Record its final outcome and elapsed time. |
| Webhook processing | Was the callback authentic and handled once? | Record signature validation and the deduplication decision. |
| Terminal state | Can the customer see the correct result? | Read the domain state and measure time from acceptance to completion. |
Give each telemetry signal one job
Metrics show whether a group of payments is failing. Logs explain one decision, such as why a signature was rejected. Traces show where one payment spent its time as it crossed service boundaries. A deployment annotation adds the final question: what changed just before the failure began?
Correlation must survive the queue without leaking payment data. I use an opaque payment reference and keep card data or authentication material out of labels. A trace ID is valuable when investigating one request, but it has high cardinality: almost every request has a different value. Using it as a Prometheus label would create too many time series, so it belongs in logs and traces instead.
 Automexia</>JSON
{
"timestamp": "2026-08-25T10:42:18Z",
"event.name": "payment.webhook.processed",
"service.name": "payment-webhook-handler",
"service.version": "<release-id>",
"deployment.environment.name": "production",
"trace_id": "<opaque-trace-id>",
"payment_reference": "<opaque-domain-reference>",
"provider": "<bounded-provider-name>",
"outcome": "accepted",
"duration_ms": 84
}SourcesOpenTelemetry
Define SLIs that cannot be fooled by HTTP success
I use one SLI for acceptance and another for completion. The acceptance SLI tells me whether the synchronous API can take valid work. The completion SLI tells me whether that work reaches an allowed final state before the promised deadline. Keeping them separate shows whether the failure happened before or after the queue handoff.
Correctness is checked at the final domain state. Callback signature failures remain a security signal, but rejecting an invalid callback is expected behavior rather than an availability failure.
The query below shows the shape of a completion ratio. It assumes that every eligible attempt produces one terminal observation. A reconciler marks work as timed out after its deadline, so stuck work cannot disappear from the calculation. Before adopting the query, a team must write down what makes an attempt eligible and which final states count as success.
- Acceptance: valid payment commands accepted without an internal error.
- Completion: accepted commands reaching a permitted terminal state within the objective.
- Latency: completion duration measured end to end, not only controller response time.
- Correctness: confirm that the stored result matches the provider result. Then verify that the customer sees that same state.
Automexia</>PromQLsum(rate(payment_outcomes_total{
eligible="true",
outcome="completed",
within_slo="true"
}[30m]))
/
sum(rate(payment_outcomes_total{eligible="true"}[30m]))Make the dashboard an investigation path
The top row answers whether customers are receiving a result on time. It shows how many accepted payments finish successfully. Beside that result, the age of the oldest unfinished payment reveals whether delayed work is still progressing. The next row shows where that work is waiting. Infrastructure charts appear only after the dashboard has located the affected stage.
That order matters during an incident. A responder can see that acceptance is stable while completion falls and queue age rises. The queue-age chart should open the queue view for that service. A webhook failure should open filtered traces for that handler. Each link continues the investigation instead of sending the reader to a generic platform dashboard.
| Observed symptom | Next comparison | Likely investigation branch |
|---|---|---|
| Acceptance falls | Compare errors before and after the latest release. | Start at the API path and its immediate dependency. |
| Acceptance is stable while queue age rises | Compare the publish rate with the consumer completion rate. | Trace one consumer job to find blocking work or a slow dependency. |
| Webhook rejection rises | Group rejection by signature result. | Check whether configuration changed before inspecting provider payload shape. |
| Completion slows while service resources remain stable | Compare provider time with database time. | Investigate the slower external boundary. |
Page on threatened outcomes, then attach causes
A useful page begins with one sentence about user impact. The alert goes to the team that can change the failing service. Its link opens the dashboard at the threatened objective, not a generic infrastructure page. The runbook starts with one safe check that can narrow the problem. Queue depth alone cannot do this because the same depth may be normal during a burst. The age of the oldest item reveals whether work is still progressing.
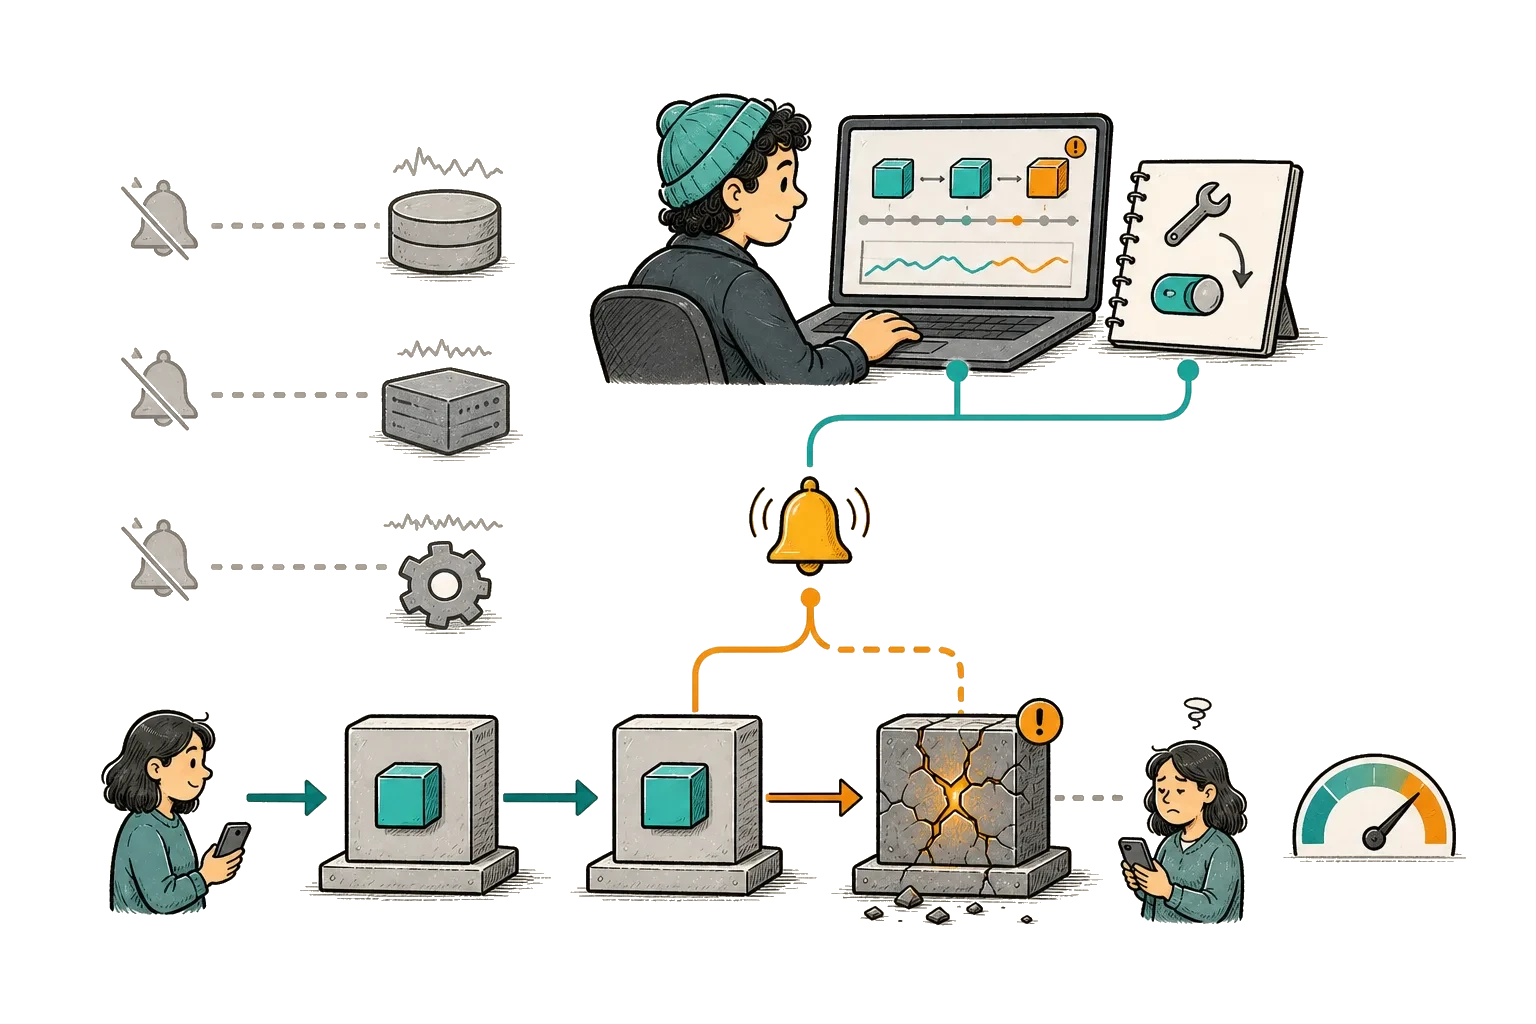
I prefer multi-window alerting. One short window detects a severe failure quickly, while a longer window catches a smaller failure that continues. The burn rate describes how quickly the service is consuming its allowed error budget. Its threshold and evaluation windows must come from the service objective and must be tested with historical or synthetic events. Related cause alerts should be grouped or inhibited so one provider failure does not wake every downstream team independently.
- Page: a payment objective is burning fast enough to require immediate human action.
- Ticket: an operational weakness needs work but is not harming users now.
- Dashboard annotation: mark a production change so later symptoms have a clear comparison point.
- Security signal: signature failures require separate routing and should not expose payload data.
SourcesPrometheus
Test an alert before it can page anyone
A syntax check only proves that Prometheus can parse the rule. It does not prove that the alert waits for the intended duration or clears when the payment journey recovers. A small unit-test file should live beside the rule. The test feeds synthetic metric values into the expression and states exactly when the alert should be silent and when it should fire.
The useful minimum is three cases. Normal traffic must remain silent. A brief spike shorter than the configured duration must also remain silent. A sustained completion failure must fire and identify the owning team. It must also include the runbook link. This makes the alert behavior reviewable before it can interrupt a person.
Check that Prometheus can parse the alert rule
Run the static check before loading the rule anywhere. It catches malformed YAML and invalid rule definitions without contacting the production Prometheus server.
Automexia Ubuntu-24.04
promtool check rules payment-alerts.ymlChecking payment-alerts.yml
SUCCESS: <rule-count> rules foundReplay the alert against synthetic metric values
Now evaluate the rule with the unit-test file. The test file should describe normal traffic, a short spike, and a sustained failure without using customer data.
AutomexiaUbuntu-24.04promtool test rules payment-alerts.test.ymlUnit Testing: payment-alerts.test.yml
SUCCESSSourcesPrometheus
State what the evidence proves—and what it does not
I can substantiate two production facts. The reactive services were designed for more than 500 transactions per minute. Prometheus and Grafana were introduced so operators could see service behavior and diagnose incidents. I do not have a publishable before-and-after measurement for mean time to detect or an alert-volume baseline, so I will not invent one.
The next step is to version the telemetry contract so a renamed field cannot silently break a dashboard. I would also trigger each critical alert during a controlled failure. That test should prove that the alert reaches the correct team and opens useful evidence. Finally, I would track how many payments lose correlation. This shows whether an investigation can still follow one payment from start to finish.
Observability also has a cost. Dividing telemetry spend by successful payments makes that cost visible as traffic grows.
A histogram places latency observations into configured ranges called buckets. Those boundaries need to sit around the latency objective the service actually promises. Averaging percentiles from individual instances does not produce a valid percentile for the fleet.
- Keep a bounded label policy and review new dimensions before deployment.
- Preserve errors and slow traces intentionally when sampling normal traffic.
- Monitor the monitoring path. Alert when telemetry arrives late or disappears.
- Record which OpenTelemetry naming version the service follows because field names evolve.
SourcesPrometheusGrafana Labs
Key takeaways
- Model observability around the payment state machine, not the deployment diagram.
- Separate request acceptance from asynchronous completion and correctness.
- Keep high-cardinality and sensitive values out of metric labels.
- Make dashboards and alerts lead from user impact to one bounded investigation path.
- Publish measured results and sanitized examples as different kinds of evidence.
References & revisions
Primary documentation supports the technical guidance below.
- OpenTelemetry semantic conventions OpenTelemetry
- Histograms and summaries Prometheus
- Alerting rules Prometheus
- Dashboard documentation Grafana Labs
- Unit testing for Prometheus rules Prometheus
Revision history
Rebuilt the article around a guided payment investigation. Its Prometheus checks now use compact, copyable Automexia captures with colored validation output.