
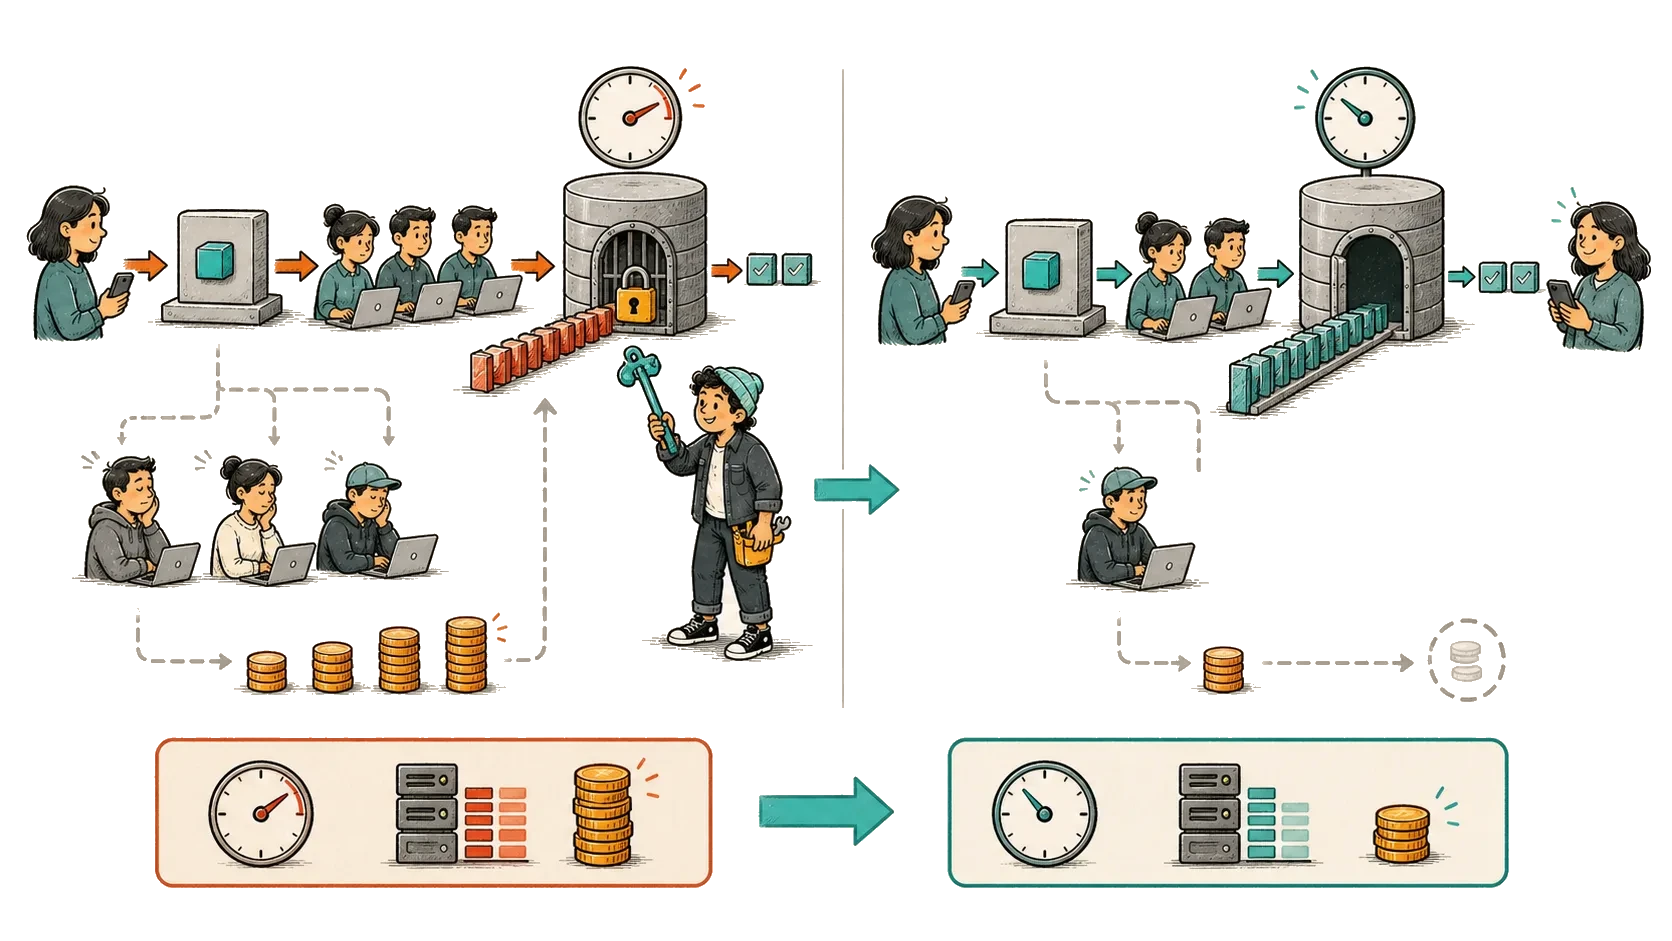
“Make it faster” described two different problems in my work. A reactive payment path handled bursts and waited for external callbacks before showing a final result. A document engine used Quarkus and Apache POI to generate more than 7,000 documents per day.
For payments, speed meant reaching the correct final state before the customer noticed a delay. For document generation, speed meant draining the backlog without exhausting memory. The same CPU graph cannot explain both outcomes, so I start by describing the work before interpreting the resources.
Describe the workload before interpreting utilization
A performance baseline starts by defining one unit of completed work. For payments, the unit cannot stop at the HTTP response because the provider callback arrives later. For documents, the unit must include a correct file and an advanced workflow state.
I then measure how the work arrives. A steady rate behaves differently from a short burst, even when the daily total is the same. Finally, I record how many units run together and how payload size changes their service time. Those details make later CPU and memory graphs interpretable.
This prevents a common mistake: comparing average CPU between services and calling the lower number waste. A waiting service can have low CPU and poor latency; a compute-heavy batch worker can have high CPU and healthy throughput.
The decision was to stop asking which service used more resources and instead ask whether each workload completed safely. That changed the experiment. The payment test follows end-to-end completion during a burst, while the document test measures backlog progress and memory retained by each active job.
| Dimension | Reactive payment path | Document-generation path |
|---|---|---|
| Published scale | >500 transactions/minute design target | >7,000 generated documents/day capability |
| Primary outcome | Correct terminal payment state inside a latency objective | Correct document produced and workflow advanced |
| Where time may go | The service may wait for a provider response or queued work. | The worker may wait for source data or storage. |
| Where pressure appears | Too many concurrent requests can exhaust a connection pool. | Large files and too many workers can retain excessive heap. |
| Capacity signal | Track unfinished work and the age of its oldest item. | Track backlog age and memory used by one active job. |
Find out where elapsed time is spent
Elapsed time is a budget. Some of it is active application work. The rest may be spent waiting for a dependency or sitting in a queue before a worker starts. A trace explains an online request, while queue timestamps explain delay that happens before the process receives the job. A CPU profiler cannot see that queue wait.
The baseline template keeps the experiment honest. I warm the system first, then measure normal traffic and a representative peak. If deployments or scaling events are part of daily operation, the window includes one of them. This prevents a clean laboratory interval from hiding the behavior operators actually face.
 Automexia</>YAML
workload: <payment-or-document-flow>
window: <representative-period>
input:
arrival_shape: <steady-burst-or-batch>
concurrency: <measured-value>
payload_distribution: <p50-p95-max>
observe:
- completion_rate
- p50_p95_p99_or_job_duration
- queue_age_and_depth
- dependency_wait
- cpu_memory_gc
- retries_and_redelivery
change: <one-controlled-variable>
rollback_when: <pre-agreed-condition>Treat reactive code as a concurrency model, not a speed claim
Spring WebFlux provides non-blocking I/O, but a reactive controller cannot make a blocking dependency disappear. A traditional JDBC database call or a synchronous library supplied by a provider can still occupy the event loop. When that happens, a small amount of blocking work can increase tail latency for many unrelated requests.
I inspect thread use at every boundary. Blocking work is either removed or moved to a bounded scheduler with a clear concurrency limit. During the load test, I first confirm that the event loop keeps making progress. Then I watch the scarce dependency pool and the age of unfinished work. I also measure p99 latency, the duration below which 99 percent of completed requests fall. Controller latency alone is not enough because it ends before the payment journey does.
- Propagate deadlines so abandoned requests do not continue consuming downstream capacity.
- Bound concurrency before a scarce provider or database connection pool becomes the queue.
- Measure p99 and timeout rate; averages hide the customers waiting longest.
- Warm the system with realistic payloads. Verify that the load generator can produce the intended rate.
SourcesSpring Framework
Tune queue consumers for safe recovery
RabbitMQ prefetch controls how much unacknowledged work one consumer can hold. Raising it may improve throughput, but every extra message also consumes memory and may be replayed after a failure. The useful limit is therefore the amount of in-flight work the process and its downstream dependency can recover safely.
I create a controlled backlog and raise prefetch in small steps. After each step, I check whether the oldest message becomes younger and whether memory remains comfortably below the container limit. I then restart a consumer and observe how much work is redelivered. A higher throughput number is rejected if recovery becomes unsafe.
| Observation | Likely constraint | Next experiment |
|---|---|---|
| Backlog grows while downstream calls slow | The dependency is the limiting boundary. | Reduce concurrency and confirm that dependency latency recovers. |
| Backlog grows while CPU stays low | The consumer may be blocked or under-delivering work. | Trace one job before changing prefetch. |
| Throughput improves but memory jumps | The consumer is holding too much unfinished work. | Lower prefetch and repeat the failure test. |
| Restarting creates heavy redelivery | Acknowledgement may happen at the wrong boundary. | Acknowledge only after the durable outcome, then test replay again. |
SourcesRabbitMQ
Cache stable reads, then design invalidation and failure
On the payment platform, Redis cached tokens and application configuration so the services repeated fewer PostgreSQL reads. I did not give both data types one generic time to live, or TTL. The TTL defines how long a cached value may remain before it expires. A token has a security boundary, while configuration has a different tolerance for staleness.
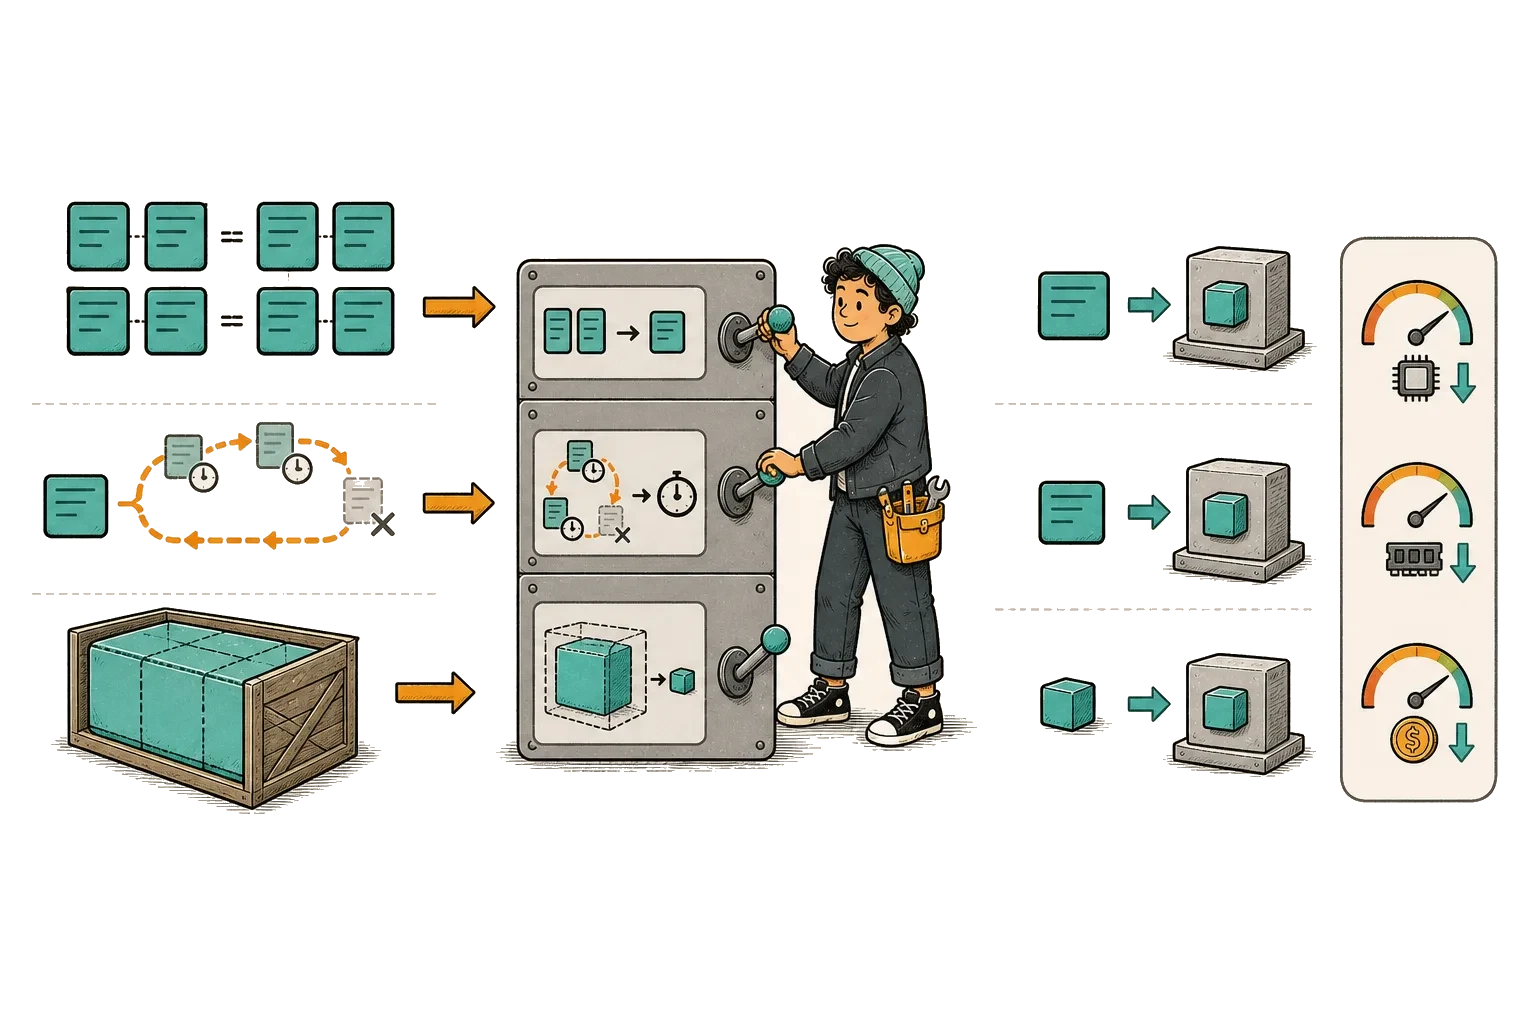
For each cached value, I ask how stale it may become. I name the event that invalidates it and decide what the service should do when Redis is unavailable. For security-sensitive configuration, a slower authoritative read may be safer than serving stale data.
The cache must also avoid a stampede after expiration. A stampede happens when many requests notice the same missing value and all reload it from the primary store. I coalesce those requests so one load supplies the others, then bound the memory used by cached entries. Hit rate is useful only when it is read beside primary-store load and correctness failures.
- Classify data by acceptable staleness and failure consequence.
- Coalesce concurrent requests for the same hot key after expiration.
- Track hit rate together with primary-store load and correctness incidents.
- Flush or bypass local cache state when invalidation connectivity is uncertain.
SourcesRedis
Size Kubernetes memory from process behavior, not heap alone
Kubernetes uses the memory request when scheduling a pod and enforces the memory limit while it runs. A Java process consumes more than heap. Thread stacks and direct buffers, for example, live outside the heap but still count toward the container limit. Setting the limit equal to the heap target removes the headroom those components need.

The decision I changed was to stop using the Java heap target as the container size. Heap describes memory used for Java objects, not the whole process. I start with resident memory, which is the process memory currently held in physical memory from the operating system perspective. I then compare it with heap after garbage collection and investigate the remaining non-heap use.
On the payment platform, tuning the application and container settings reduced OOMKill incidents. An OOMKill occurs when Kubernetes terminates a container after it exceeds the enforced memory boundary. I do not have a publishable incident count, so the result remains directional rather than a percentage improvement.
I change the JVM setting and Kubernetes limit separately when possible. After each change, I repeat the same workload and watch garbage-collection pauses as well as resident memory. This makes a regression easier to attribute and keeps the previous resource profile available for rollback.
- Request enough memory for expected steady operation so scheduling reflects reality.
- Leave measured non-heap and failure headroom below the container limit.
- Test the temporary overlap created by a rolling deployment. Repeat the test while draining a backlog.
- Change one major control at a time and keep the previous resource profile available for rollback.
SourcesKubernetes
Compare container memory with JVM memory before raising the limit
The output uses placeholders because the values must come from a repeatable workload. Reserved memory is address space the JVM may use later. Committed memory has been made available to the JVM, but it is not identical to the container reading. If committed heap is stable while the container keeps growing, I inspect the NMT categories and operating-system evidence before raising the limit.
This sequence has strict prerequisites. NMT is off by default and must be enabled when the JVM starts. Oracle documents a performance overhead of roughly 5 to 10 percent, so the choice must be tested for the service. The runtime image must contain a compatible jcmd binary. The command also needs permission to attach to the Java process and must target the correct process ID. NMT does not account for every third-party native allocation. Kubectl top is optimized for recent resource usage rather than precise forensic accounting.
Read the container memory signal from Kubernetes
Start with the memory value Kubernetes exposes for the container. This is a recent operational reading that helps establish whether the container is close to its limit.
Automexia Ubuntu-24.04
kubectl -n '<namespace>' top pod '<pod>' --containers| POD | NAME | CPU(cores) | MEMORY(bytes) |
|---|---|---|---|
| <pod> | <container> | <cpu-usage> | <container-memory> |
Ask the JVM where its committed memory is going
Next, request an NMT summary from the Java process. This separates committed heap from JVM-managed native areas such as thread stacks and garbage-collector structures.
AutomexiaUbuntu-24.04kubectl -n '<namespace>' exec '<pod>' -c '<container>' -- jcmd '<java-pid>' VM.native_memory summary scale=MB<java-pid>:
Native Memory Tracking:
Total: reserved=<reserved>MB, committed=<committed>MB
- Java Heap (reserved=<heap-reserved>MB, committed=<heap-committed>MB)
- Thread (reserved=<thread-reserved>MB, committed=<thread-committed>MB)
- GC (reserved=<gc-reserved>MB, committed=<gc-committed>MB)SourcesKubernetesOracle Java
Do not claim cloud savings without an auditable cost baseline
The previous article promised lower cloud cost but contained no production cost data. I removed that claim. Lower CPU or fewer pods may improve efficiency, but the invoice can still rise because traffic grew or pricing changed. Shared infrastructure also makes one service difficult to price without an allocation rule.
If cost becomes an objective, I would measure cost per successful payment and per generated document. The calculation must assign a fair share of the cluster and its observability services to each workload. Storage and network transfer must also be included when they materially change. Only then can a capacity change be called a cost improvement rather than an efficiency hypothesis.
A trustworthy performance report may conclude “faster and more stable; cost impact not measured.” That is stronger than an unsupported savings percentage.
Key takeaways
- Define the work unit and arrival shape before interpreting resource graphs.
- Separate time spent doing work from time spent waiting in a queue or on a dependency.
- Reactive code still needs a clear boundary around blocking work and scarce dependencies.
- Accept a tuning change only when the workload still recovers safely after failure.
- Do not publish a cloud-cost result without an auditable unit-cost baseline.
References & revisions
Primary documentation supports the technical guidance below.
- Spring WebFlux reference Spring Framework
- Consumer acknowledgements, publisher confirms, and prefetch RabbitMQ
- Client-side caching reference Redis
- Resource management for Pods and containers Kubernetes
- kubectl top reference and measurement limits Kubernetes
- Native Memory Tracking in Java 21 Oracle Java
Revision history
Narrowed the article to two real workloads. Container and JVM memory checks now use compact, copyable Automexia captures with colored diagnostic output.